Notes from reading the online book Think Bayes: Bayesian Statistics Made Simple.
Chapter 5 Odds and Addends
In addition to normal Bayesian formula
$$ p(H|D) = \frac{p(D|H)p(H)}{p(D)} $$
The odds form of Bayes's theorem is
$$ o(A|D) = o(A) \frac{p(D|A)}{p(D|B)} $$
i.e., the posterior odds are the prior odds times the likelihood ratio. Sometimes, this form is most convenient for computing a Bayesian update on paper or in your head.
Chapter 6 Decision Analysis
The results from Bayesian analysis comes in the form of a posterior distribution. Classical method usually generates a single point estimate, e.g. maximum likelihood or MAP estimates.
Bayesian methods are most useful when you can carry the posterior distribution into the next step of the analysis to perform some kind of decision analysis, e.g. to compute an optimal bid in this chapter, or some kind of prediction seen in the next chapter.
Chapter 7 Prediction
The Boston Bruins Problem
In the 2010-11 National Hockey League (NHL) Finals, my beloved Boston Bruins played a best-of-seven championship series against the despised Vancouver Canucks. Boston lost the first two games 0-1 and 2-3, then won the next two games 8-1 and 4-0. At this point in the series, what is the probability that Boston will win the next game, and what is their probability of winning the championship?
The following assumptions are used:
- goal scoring in hockey is at least approximately a Poisson process
- each team has some long-term average goals per game, denoted λ
Given these assumptions, the strategy for answering this question is
Use statistics from previous games to choose a prior distribution for λ. From http://www.nhl.com, it is roughly Gaussian, i.e. $N(\mu, \sigma^2)$ with $\mu=2.7, \sigma=0.3$.
Use the score from the first four games to estimate λ for each team.
Use the posterior distributions of λ to compute distribution of goals for each team, the distribution of the goal differential, and the probability that each team wins the next game.
Compute the probability that each team wins the series.
The following code shows the steps using pyMC library.
%matplotlib inline

import pymc as pm
import numpy as np
from IPython.core.pylabtools import figsize
from matplotlib import pyplot as plt
names = ['buins', 'canucks']
scores = [np.array([0,2,8,4]), np.array([1,3,1,0])]
N = len(scores)

lam   = [pm.Normal('lambda_%s' % names[i], mu=2.7, tau=1/0.3**2) for i in range(N)]
games = [pm.Poisson('games_%s' % names[i], mu=lam[i], value=scores[i], observed=True) for i in range(N)]
predicts = [pm.Poisson('predict_%s' % names[i], mu=lam[i]) for i in range(N)]
times = [pm.Exponential('time_%s' % names[i], beta=lam[i]) for i in range(N)]

mdl = pm.MCMC([lam, games, predicts, times])
mdl.sample(iter=20000, burn=10000)
from pymc.Matplot import plot
plot(mdl.trace('lambda_buins'))
plot(mdl.trace('lambda_canucks'))


buins_samples = mdl.trace('lambda_buins')[:]
canucks_samples = mdl.trace('lambda_canucks')[:]
figsize(12.5, 4)
plt.hist(buins_samples, histtype='stepfilled', bins=50, alpha=0.85,
         label="posterior of $\lambda$_buins", color="#A60628", normed=True)
plt.hist(canucks_samples, histtype='stepfilled', bins=50, alpha=0.85,
         label="posterior of $\lambda$_canucks", color="#467821", normed=True)

mb = buins_samples.mean()
mc = canucks_samples.mean()
plt.vlines(mb, 0, 1.5, lw=2, colors=u'm', label="$\lambda$_buins mean = %.2f" % mb)
plt.vlines(mc, 0, 1.5, lw=2, colors=u'k', label="$\lambda$_canucks mean = % .2f" % mc)

plt.legend(loc="upper right")
plt.title(r"Posterior distributions of $\lambda$s")
plt.xlim([1.5, 4.0])
plt.xlabel("$\lambda_1$ value")

#mdl.stats()
The sample mean for Buins and Canucks are 2.8, 2.5 respectively, so it seems Buins has advantage. (Note that the numbers are slightly different from the book: 2.6 for the Canucks and 2.9 for the Bruins.)
To compute the probability that each team wins the next game, one can use the simulated data from fitted model.
buins_predicts = mdl.trace('predict_buins')[:]
canucks_predicts = mdl.trace('predict_canucks')[:]
figsize(12.5, 4)
plt.hist(buins_predicts, histtype='stepfilled', bins=50, alpha=0.65,
         label="buins_predicts", color="#A60628", normed=True)
plt.hist(canucks_predicts, histtype='stepfilled', bins=50, alpha=0.65,
         label="canucks_predicts", color="#467821", normed=True)
plt.legend(loc="upper right")
plt.xlim([0, 12])
plt.title(r"Sample scores of next game")

game = buins_predicts - canucks_predicts
num = len(game)
prob = len(game[game > 0])*100./num, len(game[game < 0])*100.0/num, len(game[game == 0])*100./num
print 'Team Buins vs Canucks, prob. of Winning: %.1f%%, Losing: %.1f%%, Tie: %.1f%%' % prob
Sudden death
In the case of Tie, the winner is determined by sudden death in overtime. The important statistic is not goals per game, but time until the first goal, which is in exponential distribution.
need_overtime = (game == 0)
buins_times = mdl.trace('time_buins')[:]
canucks_times = mdl.trace('time_canucks')[:]
overtime = (buins_times - canucks_times)[need_overtime]
prob2 = len(overtime[overtime < 0])*100./len(overtime)
print 'Team Buins wins in overtime is: %.1f%%' % prob2
print 'Team Buins vs Canucks, prob. of Winning on next game: %.1f%%' % (prob[0]+prob[2]*prob2/100.)
The results are very close to the values given in the book.
Discussion
So it turns out that the results are sensitive to the prior, which makes sense considering how little data we have to work with. Based on the difference between the low-variance model and the high-variable model, it seems worthwhile to put some effort into getting the prior right.
Chapter 8 Observer Bias
The Red Line Problem
The Bayesian estimation approach to help predict the wait time and decide when one should give up and take a taxi. The assumptions are:
- Treat the passenger arrivals as a Poisson process, which means that passengers are equally likely to arrive at any time, and that they arrive at an unknown rate, λ, measured in passengers per minute. λ is assumed to be constant.
The arrival process for trains are not Poisson. The data is manually gathered.
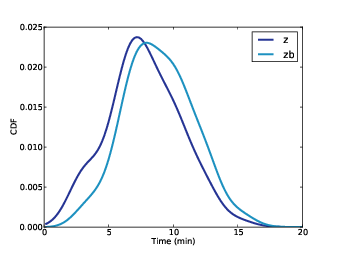
Note that the average time between trains, as seen by a random passenger ('zb'), is substantially higher than the true average ('z'). The exaplanation is in the book, because values from the actual distribution are oversampled in the proportion to their value.
%matplotlib inline

import pymc as pm
import numpy as np
from IPython.core.pylabtools import figsize
from matplotlib import pyplot as plt
# observed gaps between trains, in seconds
# collected using code in redline_data.py, run daily 4-6pm
# for 5 days, Monday 6 May 2013 to Friday 10 May 2013

OBSERVED_GAP_TIMES = [
    428.0, 705.0, 407.0, 465.0, 433.0, 425.0, 204.0, 506.0, 143.0, 351.0,
    450.0, 598.0, 464.0, 749.0, 341.0, 586.0, 754.0, 256.0, 378.0, 435.0,
    176.0, 405.0, 360.0, 519.0, 648.0, 374.0, 483.0, 537.0, 578.0, 534.0,
    577.0, 619.0, 538.0, 331.0, 186.0, 629.0, 193.0, 360.0, 660.0, 484.0,
    512.0, 315.0, 457.0, 404.0, 740.0, 388.0, 357.0, 485.0, 567.0, 160.0,
    428.0, 387.0, 901.0, 187.0, 622.0, 616.0, 585.0, 474.0, 442.0, 499.0,
    437.0, 620.0, 351.0, 286.0, 373.0, 232.0, 393.0, 745.0, 636.0, 758.0,
]
#plt.hist(OBSERVED_GAP_TIMES, bins=50)
data = np.array([x/60. for x in OBSERVED_GAP_TIMES])

from statsmodels.distributions import ECDF as empericalCDF
eCDF = empericalCDF(data)

figsize(12.5, 4)
plt.step(eCDF.x, eCDF.y)
plt.xlim([0, 20])
plt.title('Emperical cdf of RedLine observations')

Next step is density (pdf) estimation. The code below is copied from the post Kernel Density Estimation in Python.
from sklearn.neighbors import KernelDensity
from scipy.stats import gaussian_kde
from statsmodels.nonparametric.kde import KDEUnivariate
from statsmodels.nonparametric.kernel_density import KDEMultivariate

def kde_scipy(x, x_grid, bandwidth=0.2, **kwargs):
    """Kernel Density Estimation with Scipy"""
    # Note that scipy weights its bandwidth by the covariance of the
    # input data.  To make the results comparable to the other methods,
    # we divide the bandwidth by the sample standard deviation here.
    kde = gaussian_kde(x, bw_method=bandwidth / x.std(ddof=1), **kwargs)
    return kde.evaluate(x_grid)

def kde_statsmodels_u(x, x_grid, bandwidth=0.2, **kwargs):
    """Univariate Kernel Density Estimation with Statsmodels"""
    kde = KDEUnivariate(x)
    kde.fit(bw=bandwidth, **kwargs)
    return kde.evaluate(x_grid)

def kde_statsmodels_m(x, x_grid, bandwidth=0.2, **kwargs):
    """Multivariate Kernel Density Estimation with Statsmodels"""
    kde = KDEMultivariate(x, bw=bandwidth * np.ones_like(x),
                          var_type='c', **kwargs)
    return kde.pdf(x_grid)

def kde_sklearn(x, x_grid, bandwidth=0.2, **kwargs):
    """Kernel Density Estimation with Scikit-learn"""
    kde_skl = KernelDensity(bandwidth=bandwidth, **kwargs)
    kde_skl.fit(x[:, np.newaxis])
    # score_samples() returns the log-likelihood of the samples
    log_pdf = kde_skl.score_samples(x_grid[:, np.newaxis])
    return np.exp(log_pdf)

kde_funcs = [kde_statsmodels_u, kde_statsmodels_m, kde_scipy, kde_sklearn]
kde_funcnames = ['Statsmodels-U', 'Statsmodels-M', 'Scipy', 'Scikit-learn']

print "Package Versions:"
import sklearn; print "  scikit-learn:", sklearn.__version__
import scipy; print "  scipy:", scipy.__version__
import statsmodels; print "  statsmodels:", statsmodels.__version__
fig, ax = plt.subplots(1, 4, sharey=True, figsize=(12.5, 4))
fig.subplots_adjust(wspace=0)

xs = np.linspace(0, 20, 101)
for i in range(4):
    ax[i].hist(data, normed=True, label='data', bins=30)
    pdf = kde_funcs[i](data, xs, bandwidth=1)
    ax[i].plot(xs, pdf, lw=2, color='r')
    ax[i].set_xlim([0, 20])
    ax[i].set_title('pdf: ' + kde_funcnames[i])

All methods arrive at the same pdf, with bandwidth limited to 1. It is substantially different from the one in the book, even though the shape is similar.
N = 60. # use 1-second precision
xs = np.linspace(0, 20, 20*N+1)
pmf_z = kde_funcs[0](data, xs, bandwidth=1)

pmf_zb = xs*pmf_z
pmf_zb = pmf_zb/pmf_zb.sum()*N

pmf_y = np.zeros(20*N+1)
for i in range(int(20*N)):
    p = np.array([pmf_zb[i]/(i+1)]*(i+1) + [0]*int(20*N-i))
    pmf_y += p

cdf_z = np.cumsum(pmf_z)/N
cdf_zb = np.cumsum(pmf_zb)/N
cdf_y = np.cumsum(pmf_y)/N
fig, ax = plt.subplots(1, 2, figsize=(12.5, 4))

ax[0].plot(xs, pmf_z, label='z')
ax[0].plot(xs, pmf_zb, label='zb')
ax[0].plot(xs, pmf_y, label='y')
ax[0].legend()
ax[0].set_title('pmf of data')

ax[1].plot(xs,cdf_z, label='z')
ax[1].plot(xs, cdf_zb, label='zb')
ax[1].plot(xs, cdf_y, label='y')
ax[1].set_ylim([0, 1])
ax[1].legend()
ax[1].set_title('cdf of data')

mean = lambda y: np.sum(xs*y)/N

print 'The mean of z = %.2f, of zb = %.2f, of c = %.2f' % (mean(pmf_z), mean(pmf_zb), mean(pmf_y))
Predicting wait times
Assume that the actual distribution of z is given, and the passenger arrival rate, λ, is 2 passengers per minute.
cdf = lambda p: np.cumsum(p)/N

prior_x = pmf_y

#posterior calculation
lam = 2.
k = 15
l_poisson = lambda x: np.exp(-lam*x)*((lam*x)**k)/np.prod(np.linspace(1,k,k))
yy = np.array([l_poisson(x) for x in xs])*prior_x
posterior_x = yy/np.sum(yy)*N

# y = zb - x
pred_y = np.zeros(len(xs))
for i in range(len(xs)):
    for j in range(i+1):
        pred_y[i-j] += pmf_zb[i]*posterior_x[j]
pred_y = pred_y/np.sum(pred_y)*N
figsize(6.25, 4)
plt.plot(xs, cdf(prior_x), label='prior_x')
plt.plot(xs, cdf(posterior_x), label='posterior_x')
plt.plot(xs, cdf(pred_y), label='pred_y')
plt.ylim([0, 1])
plt.legend(loc='upper right')

Estimating the arrival rate
obs_k1 = np.array([17, 22, 23, 18, 4])
obs_y  = np.array([4.6, 1.0, 1.4, 5.4, 5.8])
obs_k2 = np.array([9, 0, 4, 12, 11])

# prior = Uniform[0, 5]
ts = xs[:5*N+1]
prior_lam = np.array([1./5.]*len(ts))

posterior_lam = prior_lam
l_poisson = lambda x, lam, k: np.exp(-lam*x)*((lam*x)**k)/np.prod(np.linspace(1,k,k))
for i in range(len(obs_y)):
    posterior_lam = np.array([l_poisson(obs_y[i], lam, obs_k2[i]) for lam in ts])
posterior_lam = posterior_lam/np.sum(posterior_lam)*N

figsize(6.25, 4)
plt.step(ts, cdf(prior_lam), label='prior $\lambda$')
plt.step(ts, cdf(posterior_lam), label='posterior $\lambda$')
#plt.xlim([0, 5])
plt.ylim([0, 1])
plt.legend(loc='upper left')
plt.title('estimate of cdf ($\lambda$)')

Now incorporate this uncertainty to estimate distribution of pred_y.
from numba import autojit
import copy

@autojit
def nb_calc(posterior_x):
    # y = zb - x
    pred_y = np.zeros(len(xs))
    for i in range(len(xs)):
        for j in range(i+1):
            pred_y[i-j] += pmf_zb[i]*posterior_x[j]
    pred_y = pred_y/np.sum(pred_y)*N
    return pred_y

def calc_pred_y(lam, k):
    ''' Compute pred_y with given data of (lam, k)
        Assumptions used: prior_x, pmf_zb, posterior_x
    '''
    l_poisson = lambda x: np.exp(-lam*x)*((lam*x)**k)/np.prod(np.linspace(1,k,k))
    yy = np.array([l_poisson(x) for x in xs])*prior_x
    posterior_x = yy/np.sum(yy)*N
    pred_y = nb_calc(posterior_x)
    return pred_y

agg_pred_y = np.ones(len(xs))
# figsize(6.25, 4)
pltyy = []
for i in range(len(ts)):
    lam = ts[i]
    p = posterior_lam[i]
    k = 15 # num of passengers observed is fixed
    yy = calc_pred_y(lam, k)
    agg_pred_y = agg_pred_y*yy*p
    if i % 30 == 0:
        print 'calc pred_y for lam = ', i/60.
        pltyy.append(copy.deepcopy(yy))

agg_pred_y = calc_pred_y(2, 15)
for yy in pltyy:
        plt.plot(xs, cdf(yy), ls='-.', color='blue')
plt.plot(xs, cdf(agg_pred_y), lw=2, color='r', label='mix')
plt.xlim([0, 20])
plt.ylim([0, 1])
plt.legend(loc='upper left')
plt.xlabel('wait time (min)')
plt.ylabel('CDF')

cdf_agg_pred_y = cdf(agg_pred_y)
getProb = lambda x: cdf_agg_pred_y[list(xs).index(x)]*100.
print 'Prob. of waiting more than 15 mins after arrival: P(y >= 15) = %f%%.' % (100 - getProb(15.))
Zero probability given the observations!! With adjusted sampling from the book, it is increased to about 0.02.